Now, after having had some time in the hands of developers, the Lighthouse score has increased the weight of CLS from 5% to 15%, consistent with the methodology of having Core Web Vitals be the most heavily weighted metrics in the Lighthouse score.


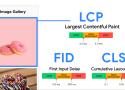
Google’s Core Web Vitals initiative has taken the SEO and Web Performance worlds by storm and many sites are busy optimizing their Page Experience to maximize the ranking factor. The Cumulative Layout Shift metric is causing trouble to a lot of sites, so let’s have a look at ways of addressing any issues for that metric.
A step by step guide on how to get started with using Cloudflare Workers for web performance optimisation.

We’re going to take a deep-dive here into two of the strategies that produced the overall biggest performance impact for us: crafting high performance animations and serving the perfect image.

Shortly before the Core Web Vitals will become a search ranking factor (June-August) for the Google mobile search, the Google team answered the most asked questions about the Core Web Vitals in their Google I/O – “Ask Me Anything Web Vitals” session.
The humble <img> element has gained some superpowers over the years. Given how central it is to image optimization on the web, let’s catch up on what it can do and how it can help improve user experience and the Core Web Vitals.

Delivering thin resources is essential, especially when it comes to HTML. If HTML is turning out big, we have no room left for CSS resources or javascript in our performance budget.
Third-party scripts, or "tags" can be a source of performance problems on your site, and therefore a target for optimization. However, before you start optimizing the tags you have added, make sure that you are not optimizing tags you don't even need. This article shows you how to assess requests for new tags, and manage and review existing ones.
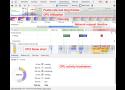
Learn how to use the Chrome DevTools Performance tab to measure and improve the speed of your website.

It might seem that such selectors would be a speed problem. However, the selector matching performance is fast. The CSS declarations are so friendly to compression algorithms that the effort required to optimise a CSS selector is usually better spent working on other parts of your application with a greater return on investment.
The other half of this statement is in the ever growing Google of it all. This update is dipping a toe into creating other measurable User Satisfaction/UX metrics. So you should be thinking-- what annoys me about websites? How would I measure that? And is my own website up to the task?

the reason we’ve been so dependent on lab data for so long is because RUM data is noisy. The steps CrUX takes to reduce this does help to give a more stable view, but at the cost of it making it difficult to see recent changes.
Don’t use runtime CSS-in-JS if you care about the load performance of your site. Simply less JS = Faster Site. There isn’t much we can do about it. But if you want to see some numbers, continue reading.

Optimizing websites for a quality user experience is key to the long-term success of any site on the web and Core Web Vitals is an initiative Google has provided as a unified guidance for quality signals that are essential to delivering a great user experience on the web. Addy Osmani and Kristofer Baxter, from Google, join us to talk more about Core Web Vitals.
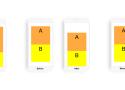
Layout shifts can be caused by the following events:
- Changes to the position of a DOM element
- Changes to the dimensions of a DOM element
- Insertion or removal of a DOM element
- Animations that trigger layout

Provide videos with a supercharged focus on visual performance. This custom element renders just like the real thing but approximately 224× faster.

The first step in improving speed is establishing who is responsible for the effort. Other than responsibility, it’s invaluable to gather a diverse group who can contribute unique ideas to the brainstorming and evaluation session (more on that below). By including people from different business areas, you’ll allow knowledge to spread throughout the organisation more freely too.

This post covers some of the performance issues related to consent banners, how I bypass the banners, and my approach to working out which cookies or localStorage items I need to set to bypass them.

If the median site continued to send 3x the recommended amount of script, when would the web start to feel usable on most of the world's devices?
The first part of this article discusses tooling for debugging layout shifts, while the second part discusses the thought process to use when identifying the cause of a layout shift.