It’s easy to get excited about new techniques for measuring and improving site speed but this focus on the technical side of performance can lead us to think of speed as a technical issue, rather than a business issue with technical roots.


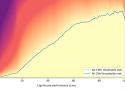
Almost half of all pages that scored 100 on Lighthouse didn’t meet the recommended Core Web Vitals thresholds.
[…]
- If you're going to talk about the performance of a production site, use real-user data.
- If you're going to use a single number to cite a performance result, specify where that number falls in the distribution.
- When talking about real-user performance, be specific about the time period.
- If you do want to brag about your Lighthouse score or other lab results, do so in the context of the larger performance story.

Core Web Vitals is a measurable SEO ranking factor. This data study shows changes seen during the Page Experience Update July-Aug 2021

Render-blocking resources are a common hurdle to rendering your page faster. They impact your Web Vitals which now impact your SEO. Slow render times also frustrate your users and can cause them to abandon your page.

Writing about browser performance is hard, but it’s not fruitless. I’ve had enough successes over the years (and enough stubbornness and curiosity, I guess) that I keep doing it.
Make use of the requestIdleCallback callback to improve the responsiveness of input while ensuring JS actions during the typing.

You now have a simple, platform-reliant way of preventing unnecessary requests. You have another tool in your belt to save your users time and money. Also you’ve got a way to save a little carbon from being released into our atmosphere to power a server farm. And you can use this tool with any style of website: static file sites, single page applications, and server rendered applications. It’s a superpower.
If your site uses native image lazy-loading, check how it's implemented and run A/B tests to better understand its performance costs. It may benefit from more eagerly loading images above the fold.
Putting images on websites is incredibly simple, yes? Actually, yes, it is. You use <img> and link it to a valid source in the src attribute and you’re done. Except that there are (counts fingers) 927 things you could (and some you really should) do that often go overlooked. Let’s see…

By combining the powers of real-user experiences in the Chrome UX Report 3 (CrUX) dataset with web technology detections in HTTP Archive 1, we can get a glimpse into how architectural decisions like choices of CMS platform or JavaScript framework play a role in sites’ CWV performance.

How Telegraph, the leading UK news website managed to improve their 75th percentile CLS by 250% from 0.25 to 0.1 in a couple of months.

Combine picture, source, the media attribute and srcset to serve sharp images to 2x+ density screens.
There are, however, plenty of tasks that require minimal effort that have a big impact on site speed. These are often overlooked in favor of lower-impact tasks.
If you want to get the best results, here are the tasks you’ll want to prioritize.
As always, the big advice here is whether you're using a framework or not, keep the total amount of JavaScript as small as possible.

… À partir du moment où vous avez identifié ce cas, je vous recommande fortement d’expérimenter la suppression de la version en gras « Bold 700 » et l’utilisation de la version « faux gras » avec la propriété CSS font-weight avec pour valeur bold ou 700.
…
Et n’en déplaise aux typographes, la différence visuelle est tellement légère par rapport à l’utilisation du poids d’une font web en plus, que cela justifie l’utilisation de ce « faux gras ».
As a web font loads, you can now adjust its scale, to normalize the document font sizes and prevent layout shift when switching between fonts.

- Imagine
- ImageOptim
- Sqoosh
- File Optimizer
- RIOT
- Compressor
- Image Resizer
- Pingo
- EzGif

Fine-tune your font files and optimise your loading strategy for maximum speed + minimum FOUT.
- Use the most modern file formats
- Use the font-display descriptor
- Preload your font files
- Subset your font files
- Self-host your fonts

This is the story of how Beau Hartshorne and his team at Instant Domain Search improved their Core Web Vitals scores. Plus, an open-source tool they’ve built along the way.

Chrome has stated their intent to make size-adjust available in Chrome 92 due for release on July 20th presumably indicating it’s almost there.
So, not quite ready yet, but looks like it’s coming in the very near future. In the meantime, have a play with the demo in Chrome Canary and see if it can go a bit closer to addressing your font loading woes and the CLS impact they cause.